How Garment Manufacturers Can Use ERP Analytics Without Big Data Teams
Garment manufacturers don't need data scientists or big data infrastructure to make smart decisions. Your ERP already has the insights you need - here's how to use them.

Sariful Islam

Every garment manufacturer I’ve met collects mountains of data. Order dates, fabric consumption, worker output, delivery timelines, vendor performance, style-wise production stats. The ERP system captures all of it, every single day.
And almost nobody looks at it.
Not because they don’t want to. Most factory owners I talk to know their data has value. They’ve heard about analytics and business intelligence and how data-driven companies are winning. But when they think about actually using that data, the mental image is intimidating. They picture expensive analytics software, specialized data teams, complicated dashboards with graphs they can’t understand, and consultants charging hefty fees to tell them things they probably already know.
So the data just sits there. Reports get generated, maybe glanced at during month-end, then filed away. Meanwhile, decisions get made the old way - based on experience, gut feeling, and whatever’s immediately visible.
Here’s what I want you to understand: you don’t need a data science department to make smarter decisions. You don’t need AI or machine learning or “big data” infrastructure. The insights that can actually improve your factory operations are already sitting inside your ERP system. You just need to look at them differently.
The Myth of ‘Big Data’
There’s this perception that analytics is for large corporations with dedicated teams and massive budgets. That’s not wrong, but it creates a harmful assumption: small and medium factories can’t do analytics because they don’t have those resources.
The truth is simpler. Big data is about volume and complexity - millions of transactions, real-time processing, predictive algorithms. That’s useful if you’re running a multinational supply chain or targeting ads to billions of users.
But for a garment factory producing 500 to 5,000 pieces daily? You don’t need big data. You need right data.
Right data means looking at the information you already have and asking useful questions. It means turning raw numbers into practical insights that help you order materials smarter, schedule production better, and spot problems before they become crises.
No special tools required. No data scientists. Just your ERP system and the willingness to actually use what it’s showing you.
Where the Data Already Exists
Let’s walk through what your ERP is likely already tracking:
Sales and Orders: Every order that comes in - style, quantity, delivery date, customer, pricing. Over time, this becomes a pattern. Which styles sell consistently? Which customers order regularly? Which delivery timelines are realistic versus which ones always create pressure?
Inventory and Stock: What fabric you have, what you’ve consumed, what’s in transit, what’s been sitting unused for months. This tells you about purchasing patterns, waste levels, and whether your stock planning matches actual production needs.
Production Data: How long each style takes to manufacture, which lines are faster, where bottlenecks happen, quality rejection rates. This data shows you where your factory is efficient and where it’s struggling.
Worker Performance: Output per worker, attendance patterns, efficiency trends. Not to micromanage people, but to understand capacity and identify training needs.
Vendor and Purchase Records: Which suppliers deliver on time, which ones send quality materials, pricing trends over time. This helps you make better vendor decisions and negotiate from a position of knowledge.
Financial Flows: Payment cycles, outstanding receivables, cost per unit produced. The numbers that directly affect your cash flow and profitability.
All of this is already in your system. You’re entering it daily. The question is whether you’re using it or just storing it.
Simple Analytics That Drive Real Impact
Analytics doesn’t have to be complicated. Some of the most valuable insights come from very simple observations.
Identifying Slow-Moving Stock: Export your fabric inventory report. Sort by last used date. Anything sitting unused for three months or more is tying up cash. Either use it in upcoming orders or stop buying that particular material. One client did this and realized they had nearly 15 lakhs worth of fabric that hadn’t been touched in six months. They started planning orders around that stock and freed up working capital.
Spotting Fabric Wastage Patterns: Compare your cutting plan consumption versus actual fabric used. If you’re consistently using 5-10% more fabric than planned for certain styles, something’s wrong - maybe the cutting isn’t optimized, maybe there’s quality issues with that fabric batch, maybe workers need better training. You won’t know until you look at the numbers.
Analyzing Worker Efficiency Over Time: Pull monthly output data per worker or per line. Are there specific days where efficiency drops? Maybe Mondays after the weekend break, or towards month-end when targets create pressure. Or maybe one production line consistently outperforms others because they have a better supervisor or clearer processes. These patterns guide training and workflow improvements.
Predicting Delivery Delays: Look at your past orders. How often do styles with very short lead times (under 15 days) actually ship on time? If the answer is “rarely,” you have data to push back on unrealistic delivery commitments or to build in buffer time. I’ve seen factories accept tight deadlines over and over, always scrambling and always late, because they never looked at their own track record.
Tracking Customer Order Frequency: Some customers order once and disappear. Others order regularly. When you know which customers are repeat buyers, you can plan better - keep materials ready for their preferred styles, prioritize their orders to maintain the relationship, understand seasonal patterns in their buying behavior.
These aren’t fancy analytics. They’re just questions answered with data you already have.
How to Start Using ERP Data Today
You don’t need new software. You don’t need to hire analysts. Here’s how to start:
Step 1: Export Reports from Your ERP: Most ERP systems let you export data to Excel or CSV. Start with basic reports - monthly sales by style, inventory summary, production output, vendor purchase history. Get the raw data out where you can work with it.
Step 2: Use Simple Tools: Excel is enough. Google Sheets works too. Sort the data, create simple pivot tables, add basic charts. You don’t need Power BI or Tableau for this. A bar chart showing which styles had the most rejections last month is incredibly useful, and it takes two minutes to create.
Step 3: Look for Patterns and Exceptions: Don’t just stare at the numbers. Ask questions. Which orders took the longest to complete? Which vendors had the most delays? Which styles had the highest fabric consumption variance? Patterns tell you what’s normal. Exceptions tell you what needs attention.
Step 4: Ask Better Questions: This is the key shift. Instead of “What happened last month?” ask “Why did these five orders ship late?” Instead of “How much fabric did we buy?” ask “Why are we buying this fabric if we haven’t used it in three months?” Better questions lead to better insights.
Step 5: Make It a Habit: Analytics isn’t a one-time exercise. Set aside time weekly or monthly to review key reports. Make it part of your routine, like checking cash flow or reviewing pending orders. The more regularly you look at the data, the faster you’ll spot emerging issues.
The Role of Design in Analytics
Here’s something most people miss: analytics isn’t just about numbers. How the data is presented matters enormously.
I’ve seen ERP systems that technically track everything but display it in ways that are impossible to understand. Tables with 47 columns. Reports that require scrolling through pages of numbers to find one relevant figure. Dashboards crammed with so many charts that you can’t tell what’s important.
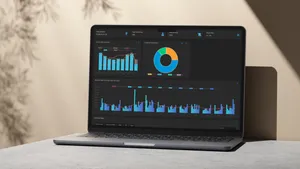
Good analytics design does the opposite. It shows you what matters, clearly and immediately. A well-designed dashboard lets you see at a glance: Are we on track for this month’s targets? Which orders are at risk of delay? What’s our current stock value? No digging required.
This is why we put so much effort into the reporting and dashboard sections of our ERP system. Not because fancy graphs look impressive in demos, but because clear visual information actually gets used. If a production manager can open a screen and instantly see which lines are behind schedule, they can act on it. If they have to export data, clean it up, create their own charts - they won’t. It’s too much friction.
Analytics tools don’t need to be complicated, but they do need to be clear. If you’re using an ERP that makes it hard to see useful insights, that’s a design problem, not a data problem.
You Already Have What You Need
The biggest barrier to using analytics in small and medium factories isn’t technology. It’s not budget or expertise. It’s the belief that analytics is too complicated, too expensive, or meant for someone else.
That belief keeps valuable insights locked inside your ERP system while you make decisions based on incomplete information.
You don’t need a data team to understand your business. You just need the right tools and the habit of looking at your data.
Your ERP already captures production efficiency, vendor performance, style-wise profitability, inventory patterns. It’s all there. The question is whether you’re going to use it or let it sit in database tables nobody opens.
Start small. Pick one area where you feel like you’re making decisions blindly - maybe fabric purchasing, maybe production scheduling, maybe vendor selection. Pull the relevant data, look for patterns, ask better questions.
That’s analytics. Not machine learning models or real-time dashboards or predictive AI. Just using the information you already have to make smarter decisions.
The factories that thrive in the next decade won’t be the ones with the biggest data teams. They’ll be the ones that treat their ERP data as what it really is: a built-in superpower waiting to be used.